Welcome to PC-TraFF Server
What is pointwise mutual information?
Transcription factors (TFs) bind to the DNA at specific binding sites (TFBSs) in order to regulate gene transcription. The knowledge of these TFBSs on promoters provides important information which TFs are involved in the regulation of which genes. In higher organisms gene expression is not dependent on single TFs but on the interaction between them. Further, interacting TFs are likely to bind next to each other on the DNA. The identification of interacting TFs can therefore be based on the fact, that their respective TFBSs are placed more often next to each other than by pure chance. This aspect can be calculated using pointwise mutual information (PMI). The PMI of two TFBS ta and tb is defined as

The PC-TraFF algorithm
The detection of potential interacting TFs is based on their TFBSs that are determined using MATCHTM. Afterwards, PC-TraFF calculates significant TFBS pairs and an interaction
network is created based on this pairs. As an optional, final step, the Marcov-clustering algorithm determines clusters of TFBSs that are very likely to form a kind of interaction modules. <- mehmet....
MATCHTM
MATCHTM is a tool that takes DNA sequences as input and searches for potential TFBSs using a library of PWMs. For each potential TFBS MATCH calculates two scores, the matrix
similarity score (MSS) and the core similarity score (CSS), further, for each PWM a threshold is given regarding each score. If the MSS and the CSS value of a TFBS exceed their respective threshold, the binding site is said to be significant. MATCHTM outputs for each sequence a list of potential TFBSs including their MSS and CSS values as well as their position on the sequences.
Scanning the sequences for TFBSs we used a library of PWMs proposed by Deyneko et al. including PWMs from TRANSFAC (release 2014.1).
PC-TraFF
For the detection of potential interacting TFs we applied PC-TraFF. The PC-TraFF algorithm consists of six phases:
Phase 1: Construction and filtering of the TFBS-sequence matrix
The construction of the TFBS-sequence matrix M is based on the frequency of predicted TFBSs in each sequence.
The rows of the matrix correspond to the sequences while the
columns correspond to the TFBSs. An entry in the matrix at position (i,j) corresponds to the frequency of TFBS tj in sequence si.
Afterwards M is filtered in order to reduce: i) the bias of highly represented TFBSs in all sequences, ii) the noisy effect of false signals arising from insufficient data.
For this purpose, the standard deviation σ of the entire matrix M based on its column sums is calculated and all columns are eliminated that have a column sum greater than 3 x σ. Further, the zero percentile of all columns is calculated and a column is removed, if it consists of more zero entries than average.
Phase 2: Identification of important TFBSs in each sequence
On the basis of the filtered matrix M, the importance of ech TFBS in the context of the entire sequence set is determined using the pointwise mutual information.
The pointwise mutual information between sequence si and TFBS tj (PMIst) is defined as

A positive PMI(si;tj) indicates that TFBS tj occurs in sequence si more often than by chance and is therefore important for si. In the following steps we consider only those TFBSs for a sequence that are important for it.
Phase 3: Filter to avoid overlaps
The MATCHTM program predicts all potential TFBSs for the given PWM-library. Therefore, it is possible that some TFBSs are overlapping each other. Overlapping TFBSs of the same type can result in their overestimation in the analysis. To avoid this, overlapping TFBSs of the same type are filtered based on their distance to the TSS. Thus, only that TFBS is taken into account in the following analysis steps that has a closer distance to TSS compared to its overlapping partner.
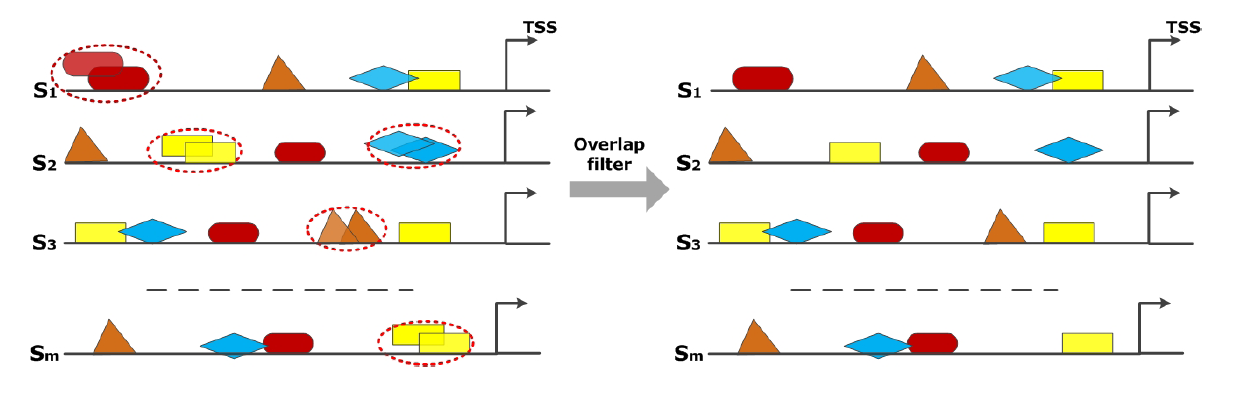 |
| Filtering procedure of the overlap filter. Overlapping TFBSs of the same type (marked in red cycles) are filtered in a way that the TFBS survives which is closer to TSS. |
Phase 4: Construction of TFBS pairs
The distance dtAtB between two TFBSs ta and tb is defined based on their midpoints CtA and CtB:

The midpoint CtA of a TFBS tA is defined as ⌊ lengthA/2 ⌋ where lengthA is the length of tA. Two TFBSs form a pair, if dmin ≤ dtAtB ≤ dmax where dmin and dmax are the minimal and maximal distance constrains, respectively. This distance constrains are defined by the user. A repeated number of TFBSs of the same type within a certain interval on DNA can lead to false positive counts of TFBS pairs. To avoid this overestimation of TFBS pairs one TFBS is only allowed to participate in a pair of specified TFBSs within a certain interval (predefined distance).
 |
| The problem of homotypic clusters: The TFBSs (Tblue) form an homotypic cluster within a certain interval on the sequence. The TFBS Tred is also included in this interval. According to our definition to construct TFBS pairs and by following the DNA strand in 5'-3' direction: i) we consider one tblue -tred pair in this interval indicating that an individual TFBS can only participate in one count of a specified pair (shown with black line); ii) if we consider tblue-tblue pairs, there are two pairs within this interval (shown with blue lines). The red (dashed) lines demonstrate that the remaining tblue-tblue and tblue-tred pairs are not taken into account in the calculation of pointwise mutual information of this pairs. |
Phase 5: Weighted cumulative pointwise mutual information
Potential collaborating TFs are determined using the weighted cumulative pointwise mutual information (PMIpc) that is based on the co-occurence of the corresponding TFs.
The PMI(tA,tB) between two TFBSs tA and tB is defined as

where p(ta,tb) is the joint probability, p(ta) and p(tb) are the marginal probabilities for ta and tb, respectively. In order to reduce the known susceptibility of PMI to low number counts, the PMI is weighted and obtained as

where ws is the weight of sequence s that is calculated using the number of TFBS pairs Ns of sequence s.
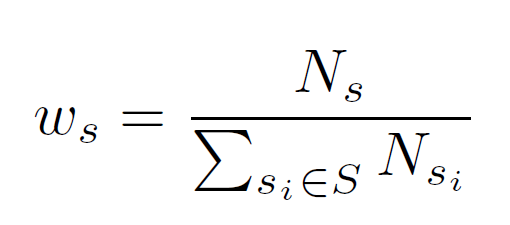
Finally, the weighted cumulative pointwise mutual information PMIpc is calculated by summing up the PMIsp(ta;tb)-values over all sequences as

Phase 6: Background noise reduction of TFBSs using average product correction
The background noise is reduced using the average product correction (APC) procedure. In this procedure, the background noise is estimated by APC and afterwards substracted from the original PMIpc value resulting in the final PMIAPCpc(ta;tb) value for TFBS pair ta and tb.

By transforming the correct PMIpcAPC(ta;tb)-values into z-score, a TFBS pair is considered to be significant, if the pair has a z-score ≥ z where z is defined by the user.
Markov clustering algorithm
The Markov clustering algorithm (MCL) is an algorithm that is able to separate high-flow regions from low-flow regions and thereby identifying densely connected TFBSs in a network. Let N:= (Ν,Ε) be the representation of the transcription factor interaction network as an adjacency matrix. Two elements (vi,vj ∈ Ν) of N are connected by an edge e(vi,vj) belonging to Ε, if and only if the corresponding TFBS pair was identified by PC-TraFF. Further, w(vi,vj) denotes the weight of an edge e(vi,vj), which represents the z-score of the TFBS pair (vi,vj) calculated by PC-TraFF.

The adjacency matrix A is then converted into a row stochastic "Markov" matrix Mnxn, where mixj represents the transition probability between nodes vi and vj in the network under study. In order to detect densely connected TFBSs in the network, the MCL can be applied on M. The basic intuition of MCL was based on a simulation of stochastic flows on the underlying interaction network to separate high-flow regions from low-flow regions. To this end, Expand and Inflate operations were applied on M until M reaches its steady state. While the Expand operation corresponds to matrix multiplication (M=MxM), the Inflate operation is used to increase the contrast between higher and lower probability transitions by taking each entry mixj in M to the power of inflation parameter r > 1 (can be given by the user). Finally, M is re-normalized into a row stochastic matrix.
TRANSFAC
TRANSFAC is a database for eucaryotic transcription factors, their DNA binding sites and some further information. The binding sites provided by TRANSFAC are represented as position weight matrices (PWMs) and can be visually displayed as logo plots. All logo plots shown in this web server are taken from TRANSFAC.
 |
| Logoplot of PWM V$CREB_Q2. Transcription factor binding sitest (TFBSs) that are represented by PWMs in TRANSFAC can simply be displayed as logoplots. In a logoplot the hight of a nucleotide at a certain position corresponds to its likelihood at this position. |
Some TFs use to haven very similar TFBSs and therefore, a PWM can represent the binding site for more than one TF. In this webserver, we display for each TFBS the TFs that it represents together with the gene description taken from TRANSFAC.
TFClass
TFClass is a classification of human transcription factors and their mouse homologs that is based on their DNA-binding domains. There are four general classification levels (superclass, class, family, subfamily) and two instantiation levels (genus and molecular species). In total, TFClass comprises nine superclasses, 40 classes and 111 families.
Server Inputs
The basis for the detection of TFBS pairs is a set of sequences. This set of sequences can either be directly uploaded in FASTA format by the user or can be specified as a list of HGNC gene symbols that are provided by the user. By providing a list of HGNC symbols, the user has the opportunity to specify the promoter regions (up- and down-stram of transcription start site (TSS)), as well as the genome release (hg19 or hg38).
 |
| Fasta format of two sequences. The sequences under analysis have to be provided in fasta format. All sequences of the set are listed in one file and each sequence is discriped in one line introduced by ">" that is written above the sequence. |
 |
| Server input. In the field "Select input data type" defines the user whether he provides a set of gene symbols or a set of sequences. By providing a set of gene symbols, the user can decide in the field "Select a database" which genome release he prefers. In "Parameters" the user can for example decide which maximal distance the TFs building a pair can have, which z-score should be taken as a significance threshold. |
Server Results
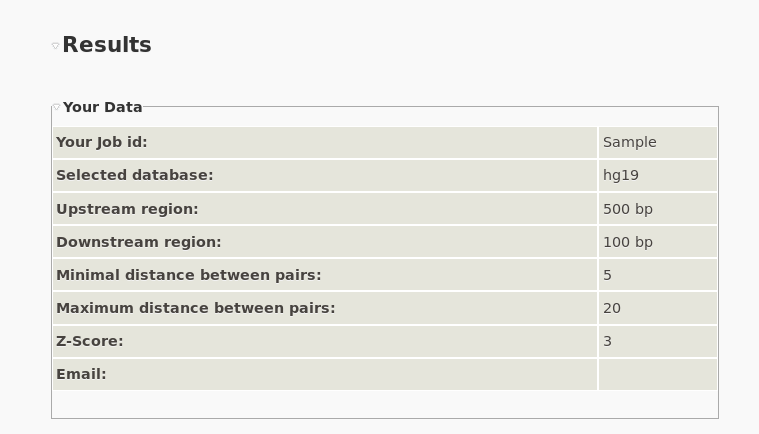 |
| Results. The first information in the result page is the recapitulation of the input details. |
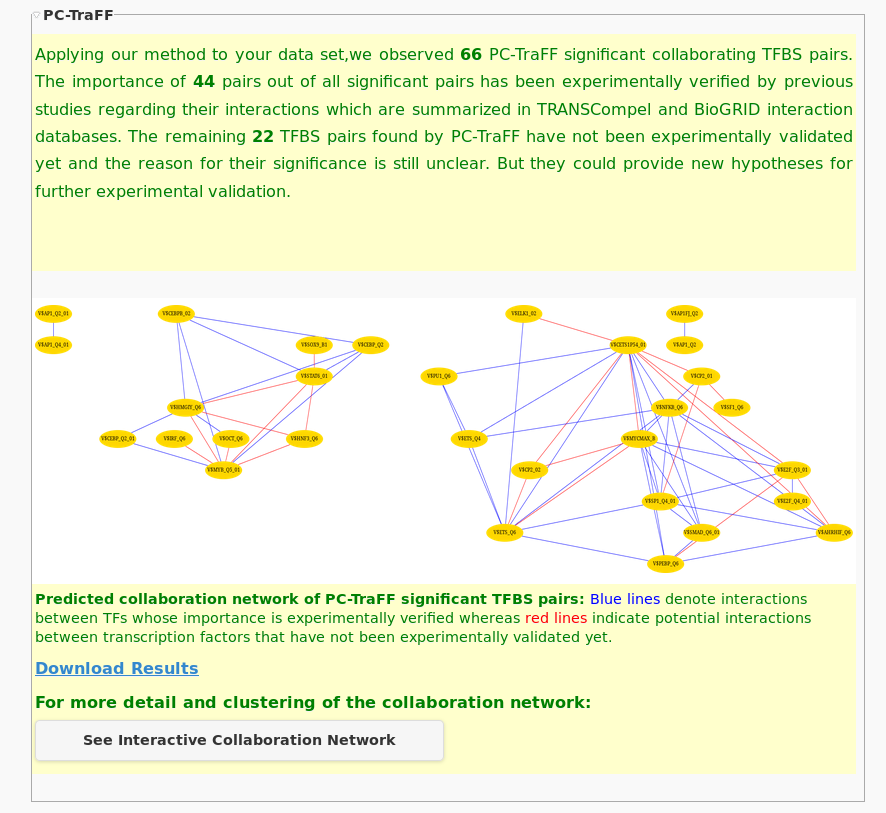 |
| Results summary and static network. In the results summary, the total number of significant pairs is given in combination with the number of pairs that have experimentally evidence as well as the number of not yet validated pairs. Further, a static network is provided with TFBSs as nodes and edges representing the potential interactions between them. |
 |
| Pair list with logoplot . The PC-TraFF significant pairs are ranked according to their z-score and if available, listed with experimental evidence. Clicking on the "info" button, the logoplots for both TFBSs of the corresponding pair appears together with the TFs binding to that TFBS. |
 |
| Interactive Network: Graph info Provided information are the number of nodes and edges as well as the hubs of the network with its top three collabortaion partners, the z-score and if available, the experimental reference. |
 |
| Node properties Selecting a node provides information about that node, like the corresponding logo plot, the TFClass classification of the related TFs as well as the TRANSFAC description of these TFs. |
 |
| Edge properties Selecting an edge, the related TFBS pair is shown in combination with its distance distribution in the sequence set. Additionally, for that genes are listed, in which the selected pair occurs most frequently. For each gene, the preferred distance, for the selected pair, in the gene is represented. |
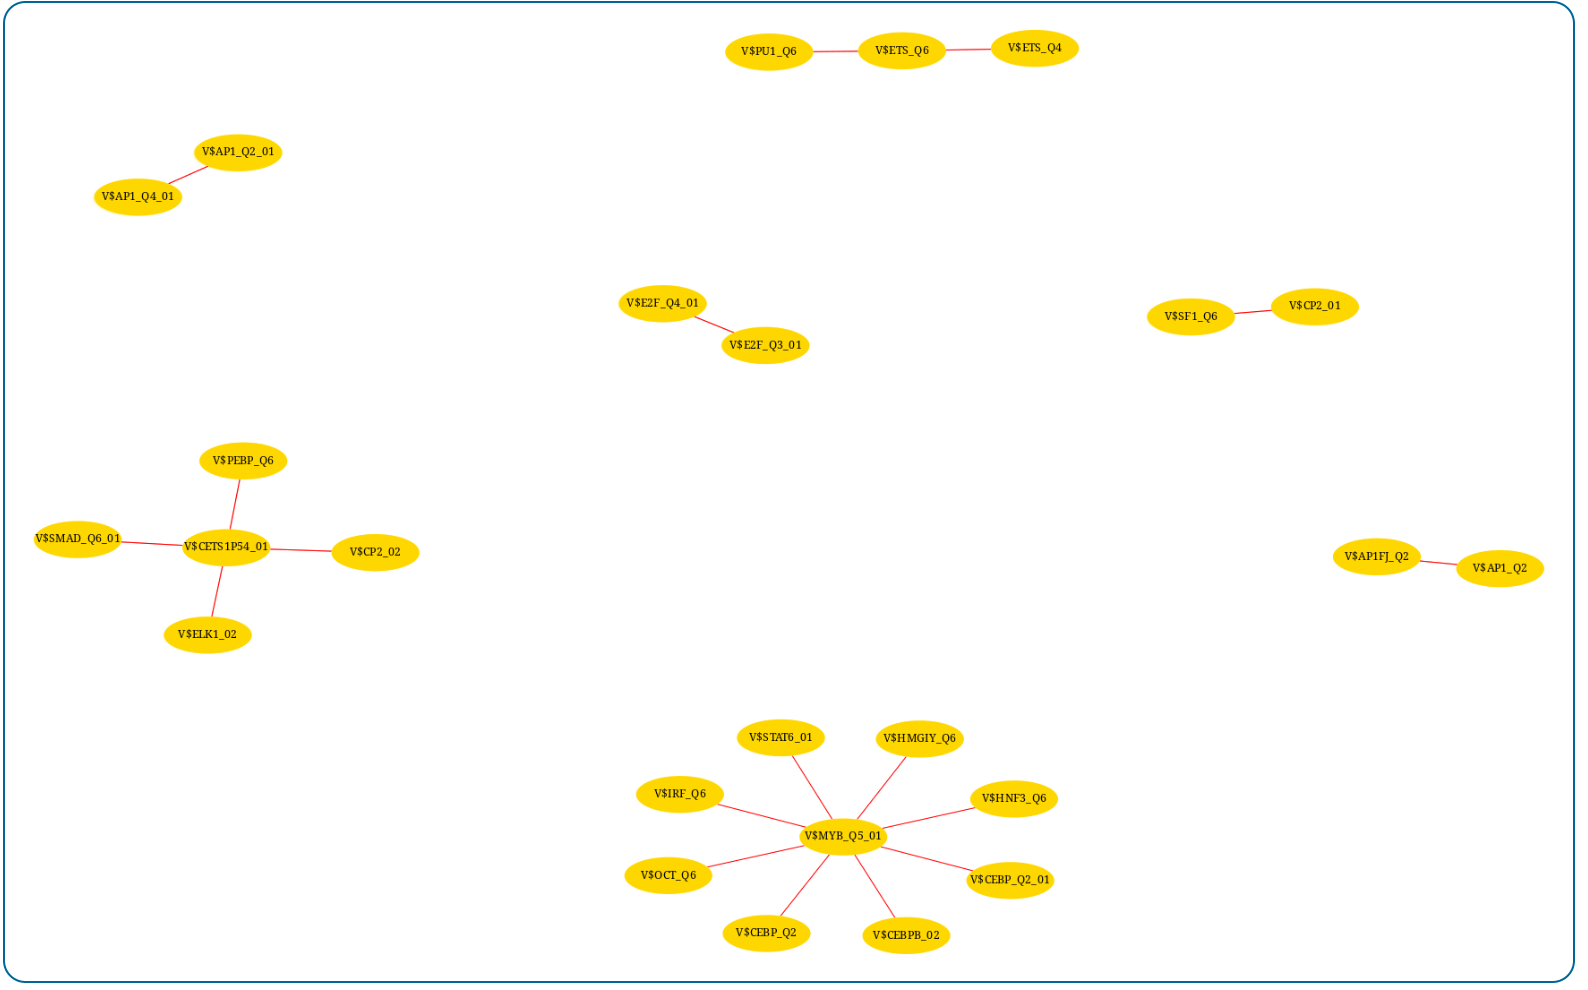 |
| Markov clustering network. The results of the Markov clustering algorithm are also presented in an interactive network. |